A while ago, one of my colleagues got to speak to a former ministerial Special Advisor (SPAD) to find out what really happens to all those campaign postcards we send to a government department.
My experience from running the Campaign Totals project over the last few years indicates that every department does things slightly differently, but here are five useful reflections from that conversation;
 1. All correspondence goes to the correspondence unit. There’s no mechanism to make anyone outside the unit aware of it. However SPADs and Ministers can enquire about what the public’s writing in about, and SPADs in particular are likely to make sure they do as a good way to keep in touch.
2. Ministers will sign and read replies to letters or emails from MPs, and usually from directors of NGOs (sometimes from other senior staff) and will also read the incoming correspondence at the same time. That’s the only correspondence they’ll usually see.
3. The department may choose to post a reply to a public campaign on its website, usually if a SPAD says they should. That’s a good way to see what they think is worth taking notice of.
4. It works well for an NGO CEO to write to a minister to say how many campaign messages they’ve received and say what they’re asking the minister to do.
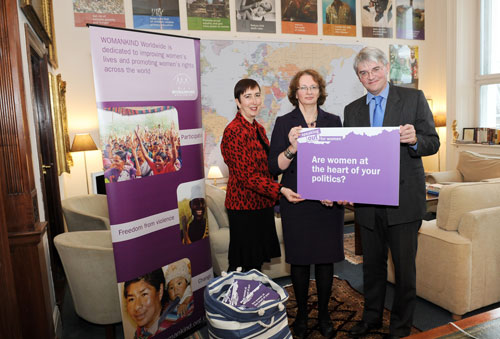
5. Hand-ins are a very good way to get a minister’s attention, if something is personally handed over to them. They’re more likely to agree if they think the photo will get good media coverage, and if there’s a celebrity involved, or someone who is seen as a celebrity by a particular audience. A hand-in with no minister present won’t come to a minister’s attention (unless you got media coverage for it).
What other insights do readers of the blog have about how to ensure your campaign postcards get noticed after a handover?
Category: action survey 2012
Campaign Totals 2012 – DFID
![]()
Total number of actions received between May 1st 2011 and May 1st 2012: 172,207
Number of postcards/letters/petitions: 159,913
Number of emails: 12,294
Biggest campaign: CAFOD – Thirst for Change – 60,477 actions
Breakdown by topic and organisation:
[googleapps domain=”docs” dir=”spreadsheet/pub” query=”key=0ArsF-z0r3hFfdDk4dGFBdmpmNnB4SGNOYS1UblpSTnc&single=true&gid=1&output=html&widget=true” width=”500″ height=”350″ /]
Scorecard based on figures from 2010 to 2012;
[googleapps domain=”docs” dir=”spreadsheet/pub” query=”key=0ArsF-z0r3hFfdDk4dGFBdmpmNnB4SGNOYS1UblpSTnc&single=true&gid=2&output=html&widget=true” width=”250″ height=”150″ /]
Par score based on number of actions at 75th percentile, birdie score on the 85th percentile, and eagle score based on the 95th percentile
View the spreadsheet in google docs here. Information taken from Freedom of Information request returned in July 2012 and has been sorted by number of actions received and is presented as it was received from DFID. More about the ‘Campaigns Total’ project here.
Be first to get the information from other departments by subscribing to the site using the box on the right, adding http://thoughtfulcampaigner.org/ to your RSS feed or following me on twitter (@mrtombaker)
Campaign Totals 2012 – Department of Education
![]()
Total number of actions received between May 1st 2011 and May 1st 2012: 3,957
Number of letters: 1,042
Number of emails: 2,915
Biggest campaign: People and Planet – Climate Change in the National Curriculum – 1,930 actions
Breakdown by topic and organisation:
[googleapps domain=”docs” dir=”spreadsheet/pub” query=”key=0ArsF-z0r3hFfdFlmTy1wNExDY0hHTlcwd0FURFhBbVE&single=true&gid=1&output=html&widget=true” width=”500″ height=”300″ /]
Scorecard based on figures from 2010 to 2012;
[googleapps domain=”docs” dir=”spreadsheet/pub” query=”key=0ArsF-z0r3hFfdFlmTy1wNExDY0hHTlcwd0FURFhBbVE&single=true&gid=2&output=html&widget=true” width=”300″ height=”150″ /]
Par score based on number of actions at 75th percentile, birdie score on the 85th percentile, and eagle score based on the 95th percentile
View the spreadsheet in google docs here. Information taken from Freedom of Information request returned on 26 May 2011 and is presented as it was received from Department of Education.
More about the ‘Campaigns Total’ project here.
Be first to get the information from other departments by subscribing to the site using the box on the right, adding http://thoughtfulcampaigner.org/ to your RSS feed or following me on twitter (@mrtombaker)
Campaign Totals 2012 – Number 10
 Total number of actions received between May 1st 2011 and May 1st 2012: 525,000
Number of postcards/petitions: 447,700
Number of emails: 49,900
Biggest campaign: Southern Daily Echo – Have a Heart campaign – 240,300
NB – Number 10 we’re keen to stress that the figures they held were averages to the nearest 100.
Breakdowns by topic and organisation:
[googleapps domain=”docs” dir=”spreadsheet/pub” query=”key=0ArsF-z0r3hFfdEVpMlJ0elJINmxyQzN5bXVSYjRIc2c&single=true&gid=1&output=html&widget=true” width=”500″ height=”500″ /]
Scorecard based on figures from 2010 to 2012;
[googleapps domain=”docs” dir=”spreadsheet/pub” query=”key=0ArsF-z0r3hFfdEVpMlJ0elJINmxyQzN5bXVSYjRIc2c&single=true&gid=2&output=html&widget=true” width=”300″ height=”150″ /]
Par score based on number of actions at 75th percentile, birdie score on the 85th percentile, and eagle score based on the 95th percentile
Information taken from Freedom of Information request returned on June 202 and is adapted from information provided by Number 10. The spreadsheets of information can be downloaded for No 10 here.
More about the ‘Campaigns Total’ project here. Be first to get the information from other departments by subscribing to the site using the box on the right, adding http://thoughtfulcampaigner.org/ to your RSS feed or following me on twitter (@mrtombaker)
Campaign Totals 2012 – HM Treasury

Total number of actions received between May 1st 2011 and May 1st 2012:
Number of postcards/letters: 51,068
Number of emails: 34,485
Number of signatures on a petition: 517,617
Biggest campaign: National Association of Master Bakers (with The Sun) – VAT on savoury products – 500,720 signatures
Breakdown by topic and organisation:
[googleapps domain=”docs” dir=”spreadsheet/pub” query=”key=0ArsF-z0r3hFfdDdqZGFHSEE2ZmZObGZQenV1T3g0MHc&single=true&gid=1&output=html&widget=true” width=”500″ height=”500″ /]
Scorecard based on figures from 2011 and 2012;
[googleapps domain=”docs” dir=”spreadsheet/pub” query=”key=0ArsF-z0r3hFfdDdqZGFHSEE2ZmZObGZQenV1T3g0MHc&single=true&gid=2&output=html&widget=true” width=”300″ height=”120″ /]
Par score based on number of actions at 75th percentile, birdie score on the 85th percentile, and eagle score based on the 95th percentile
To view the breakdown spreadsheet in google docs click here.
Information taken from Freedom of Information request returned on 8 June 2012 and is adapted from a list of information provided by HM Treasury.
More about the ‘Campaigns Total’ project here. Be first to get the information from other departments by subscribing to the site using the box on the right, adding http://thoughtfulcampaigner.org/ to your RSS feed or following me on twitter (@mrtombaker)
Campaign Totals 2012 – DECC
![]() Total number of actions received between May 1st 2011 and May 1st 2012: 158,484
Total number of actions received between May 1st 2011 and May 1st 2012: 158,484
Biggest campaign: Friends of the Earth – Stop the Big Energy Companies Taking us for a Ride – 37,578 postcards
Breakdown by topic and organisation:
[googleapps domain=”docs” dir=”spreadsheet/pub” query=”key=0ArsF-z0r3hFfdEpsTjlpTnVyOGdJTnJIbnlKbG0tY1E&single=true&gid=1&output=html&widget=true” width=”500″ height=”600″ /]
Scorecard based on figures from 2011 and 2012;
[googleapps domain=”docs” dir=”spreadsheet/pub” query=”key=0ArsF-z0r3hFfdEpsTjlpTnVyOGdJTnJIbnlKbG0tY1E&single=true&gid=3&output=html&widget=true” width=”300″ height=”120″ /]
Par score based on number of actions at 75th percentile, birdie score on the 85th percentile, and eagle score based on the 95th percentile
To view the breakdown spreadsheet in google docs click here.
Information taken from Freedom of Information request returned on 8 June 2012 and is adapted from a list of information provided by Department of Energy and Climate Change.
More about the ‘Campaigns Total’ project here. Be first to get the information from other departments by subscribing to the site using the box on the right, adding http://thoughtfulcampaigner.org/ to your RSS feed or following me on twitter (@mrtombaker)
Campaign Totals 2012 – DEFRA
 Total number of actions received between May 1st 2011 and May 1st 2012: 123,220 (down 40%)
Number of postcards/letters: 35,196 (down 62% from 92,310 in 2011)
Number of emails: 88,024 (down 19% from 109,495 in 2011)
Biggest campaign: AVAAZ – Fishing Opportunities – Submission to public consultation on fishing opportunities – 30,975 (all via email)
Breakdown by campaign:
[googleapps domain=”docs” dir=”spreadsheet/pub” query=”key=0ArsF-z0r3hFfdE5QR3dxNjA1TVRWTHZJY0E3NE5GaVE&single=true&gid=1&output=html&widget=true” width=”500″ height=”500″ /]
Scorecard based on figures from 2011 and 2012;
[googleapps domain=”docs” dir=”spreadsheet/pub” query=”key=0ArsF-z0r3hFfdE5QR3dxNjA1TVRWTHZJY0E3NE5GaVE&single=true&gid=2&output=html&widget=true” width=”300″ height=”120″ /]
Par score based on number of actions at 75th percentile, birdie score on the 85th percentile, and eagle score based on the 95th percentile
View the spreadsheet in google docs here. Information from Freedom of Information requested received on 31 May 2012, and is presented as received from DEFRA. More about the ‘Campaigns Total’ project here.
Be first to get the information from other departments by subscribing to the site using the box on the right, adding http://thoughtfulcampaigner.org/ to your RSS feed or following me on twitter (@mrtombaker)
Campaign Totals 2012
On Wednesday, I’ll be sharing the first results this years campaigns totals survey. Like last year I’ve been using Freedom of Information to find out how many campaign actions different government departments receive each year.
 I was amazed by the response that I got last year, with the results covered in Third Sector magazine and numerous campaigners getting in touch to say how helpful they’d found the information in their own internal benchmarking. I hope that this year results will prove helpful for campaigner from across the UK.
As in 2011, this year I’ve requested the information from all Whitehall departments covering the period 1st May 2011 to 1st May 2012. I’ve asked each department to provide the following;
- The total number of campaign letters, postcards and emails that appeared to be part of a coordinated campaign you received from 1st May 2011 to 1st May 2012.
- The breakdown of these numbers by delivery method (letter, postcard and email).
- A breakdown by topic and/or organisation(s) where you received more than 500 items of correspondence (through any delivery method) that appeared to be part of a coordinated campaign in the period defined above.
At the end of the process, when I’ve got results from the majority of the 20+ government departments I’ve approached I should be in a position to share a total number of actions generated to Whitehall in the last 12 months and the split between e-actions and offline actions.
This year I’m also going to be able to try to define a ‘par’ score for each government department – based on the information over the last 2 years I want to find out what like in golf, the number of actions that a department my expect to receive and therefore which campaigns are able to break through this to show real traction.
I’m also going to be interested to see what impact online campaign platforms have had in the campaign environment. Last year Avaaz showed up in the top 15, but 38 Degrees didn’t, I wonder if the focus on the NHS Bill has changed this, and what impact has the launch of change.org in the UK has had on the totals.
It’ll also be fascinating if the launch of the No10 petition site has had an impact on the number of actions. Is it a site that’s bringing more organisations and individuals into taking campaigning action, or is it displacing actions from more traditional methods. My sense is that most campaigning organisations haven’t really embraced this tool, so perhaps this has increased the overall total.
