An occasional series of fortnightly posts with useful graphs for campaigners.
Spotted this in the very useful Connectivity blog. It’s from the US, but I suspect the results would be similar in the UK.
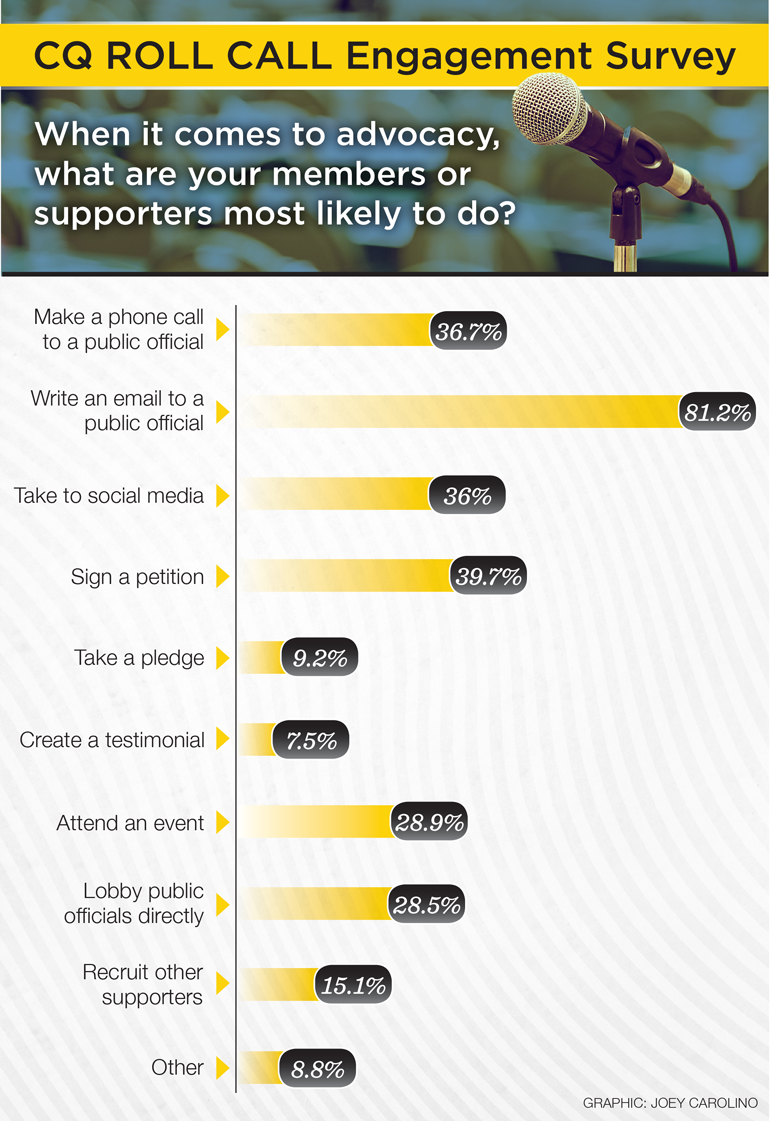
The findings came out at the same time as the results of the annual Benchmarks survey, which pulls in insight from 84 advocacy organisations, and found that;
- More people are opening advocacy emails. Advocacy open rates in 2014 were 16% — that’s 9% higher than the same organisations saw in 2013.
- Fewer people are taking action. For every 1,000 advocacy emails an organization sent, they generated 29 actions (we’re talking basic fill-out-a-form stuff like petitions and letters to Congress). That’s down 18% from the same organisations’ response rates in 2013.
Some useful food for thought as we consider who we get supporters to take the most effective actions to take.